Introduction
A necessary requirement for an industry-grade simulation software such as Aspherix® and CFDEM®coupling is the real-world accuracy of the modeled process or phenomenon. This requirement is achieved by means of a rigorous Verification and Validation (V&V) protocol.
While verification ensures that the governing equations are solved correctly by the underlying algorithms, validation assesses the degree to which the computational model accurately replicates physical reality.
In simulation engineering, validation is systematically achieved by means of:
- Analytical Validation: Verification of solver accuracy against exact mathematical solutions for simplified, canonical flow fields.
- Numerical Benchmarking: Cross-comparison of simulation outputs with established, independent numerical codes to ensure algorithmic consistency.
- Experimental Validation: Direct comparison of simulation observables against laboratory data or plant measurements.
CFDEM®coupling has been validated extensively and many results can be found in in peer-reviewed publications. Specific cases which are validated against analytical and, especially, experimental results are highlighted in what follows.
Case Study #1: Analytical Validation via the Ergun Test
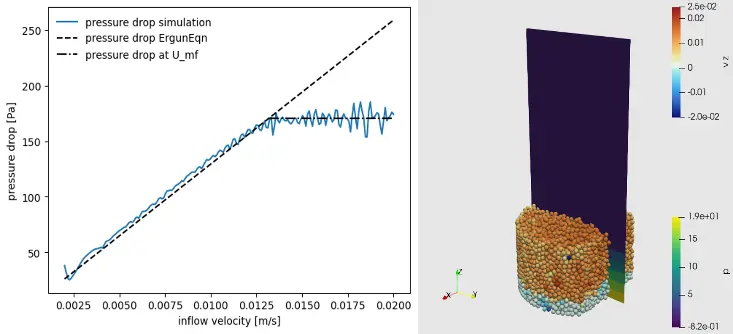
Figure 2: Pressure drop across the particle bed vs. inlet velocity, and comparison with the Ergun equation (left). The pressure drop increases linearly up to the onset of fluidization. The right image shows a snapshot of particle velocity and the pressure field at the end of the simulation.
The Ergun test consists of a initially static particle bed subjected to a homogeneous upward fluid velocity from the bottom until the onset of fluidization. The dependency between the pressure drop measured across the bed and the inlet velocity is modeled by the empirical Ergun equation:
By combining the Ergun equation with the force balance acting on the particle bed (i.e., the balance of gravity and pressure force in quasi-static conditions), we obtain the minimum fluidization velocity:
These two curves can be used as benchmark for the pressure drop obtained from a coupled CFD-DEM simulation of the Ergun test (Figure 2).


Case Study #2: Experimental Validation via a Pseudo-2D Spout-fluidized Bed
The simulation of a pseudo-2D spout-fluidized bed (Figure 3) has been validated using experimental data from literature obtained with Positron Emission Particle Tracking (PEPT) technique and Particle Image Velocimetry (PIV) (Figure 4).
The bulk solid being fluidized consists of mono-dispersed glass beads of 3 mm in diameter. More information can be found in the publication from Goniva et al [1].
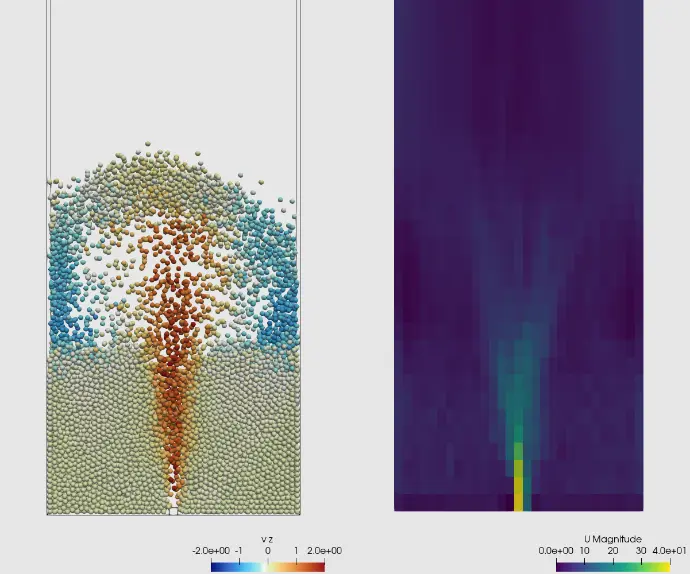
Figure 3: Snapshot of vertical particle velocity (middle) and fluid velocity magnitude (right) at the end of the simulation.
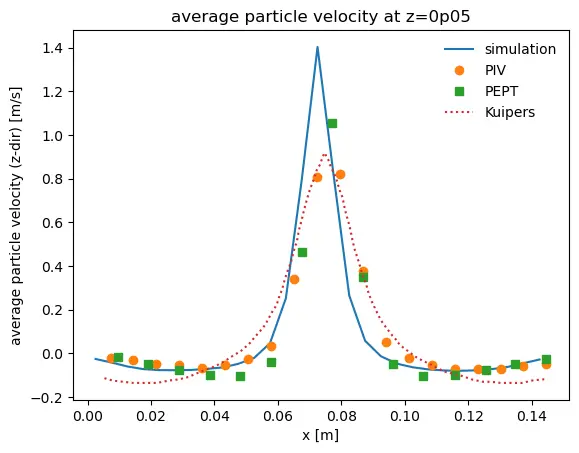
Figure 4: Average particle velocity at z = 0.05. Very good agreement with the measurements is found. Differences to the simulations by Kuipers can be attributed to the fact that those simulations did not include a rolling friction model.
The experiment used for the validation consists of a laboratory-scale cylindrical vessel measuring 0.152 meters in diameter and filled with a salt-water mixture up to a height of 1.05 meters; please refer to Gan [2] for for more information.
A continuous stream of air was injected from the bottom center via a small sparger (0.03 m wide, 0.05 m high) at a flow rate of 0.8 dm3/min. This stream naturally broke into discrete bubbles ranging from 0.7 mm to 2.3 mm in diameter. The experiment also included 20,000 monosized acrylic beads (3 mm in diameter) mixed into the liquid, establishing a volume fraction of 1.6 vol-%.
A Large Eddy Simulation (LES) of the system was performed using a CFD-DEM coupled approach, focusing solely on the bubbles as the discrete phase (Video 1). Finally, the simulated and experimental average bubble velocities were compared across various column heights.
Video 1: Coupled CFD-DEM case of a bubble column. No solid particles, neither bubble break-up nor coalescence are considered.
Case Study #3: Experimental Validation via a Bubble Column Test
Case Study #4: Settling of Two Spheres
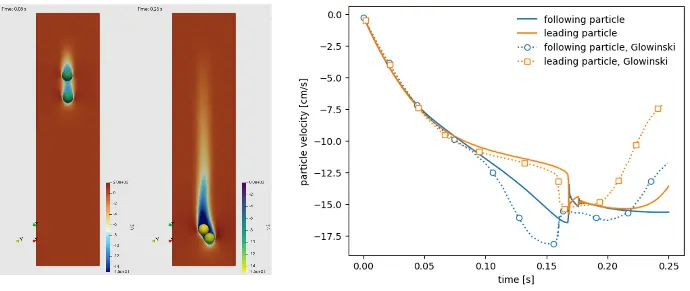
The experiment used for the validation considers two spheres falling in liquid; see Glowinski et al. [3]. Both spheres are arranged behind each other such that the trailing one travels in the wake of the leading sphere. Since it experiences less drag, the trailing sphere gains on the leading one, until the spheres finally touch and start to tumble.
The resolved CFD-DEM approach based on the Immersed Boundary Method (IBM) has been validated using the experimental data from Glowinski et al. Specifically, the simulation model employs the Shirgaonkar model for drag force, an IB-variant of the Archimedes force model to account for effective gravity differences, and an IB voidfraction model tailored for large particles.
Figure 4 shows that the simulated particle velocities agree reasonably well with the experimental data.
[1] Goniva, C., Kloss, C., Deen, N. G., Kuipers, J. A., & Pirker, S. (2012). Influence of rolling friction on single spout fluidized bed simulation. Particuology, 10(5), 582-591.
[2] Gan, Z. W. (2013). Holdup and velocity profiles of monosized spherical solids in a three-phase bubble column. Chemical Engineering Science, 94, 291-301.
[3] Glowinski, R., Pan, T. W., Hesla, T. I., & Joseph, D. D. (1999). A distributed Lagrange multiplier/fictitious domain method for particulate flows. International Journal of Multiphase Flow, 25(5), 755-794.
References
Figure 4: Particles colored by their velocity and fluid velocity field at two point in time of the simulation (left) and particle velocity over time compared the results from Glowinski et al (right).
Do you want to know more?

The Author:
Riccardo Togni, PhD
Senior Model Developer and Consultant at DCS Computing GmbH.